How to Analyze Google Forms Submission Data with AI
Analyze Google Forms survey results using AI by connecting your response sheet to Kepler.
Google Forms is excellent for collecting data, but analyzing the results usually requires exporting to Excel or struggling with the native "Summary" view, which lacks depth.
Kepler allows you to connect directly to the underlying Google Sheet, audit the data for quality (duplicates, empty rows), and ask questions in plain English.
Here is how to set up the integration and start analyzing your survey results. You don't need to download a CSV file, Kepler reads directly from your Google Drive.
- Ensure your Form is linked to a Sheet:
- Open your Google Form.
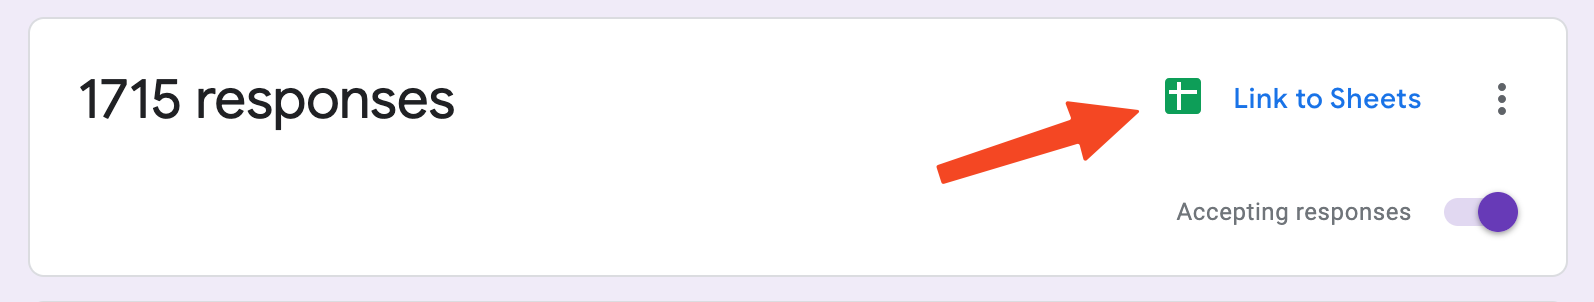
- Click the Responses tab.
- Click Link to Sheets (the green spreadsheet icon). This creates a live Google Sheet of your responses.
- Connect and Select your File:
- Go to the Kepler dashboard.
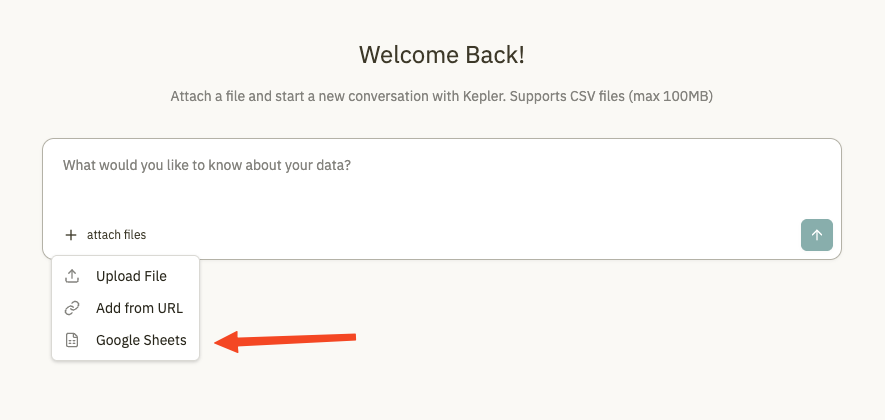
- Click Attach files → Google Sheets.
- If this is your first time, you'll see a prompt to authorize Kepler. Click Continue to connect your Google account.
- Grant read permissions when prompted by Google.
- Once connected, select the specific sheet associated with your Form from the file picker.
Privacy note: Kepler only requests access to files you explicitly select. Your other Google Drive files remain private and inaccessible to Kepler unless you choose to share them.
You're now ready to go. Ask Kepler anything about your form data, and it'll run the analysis for you.
Example Analysis Workflows
Once the data is loaded, you can ask questions. Since Kepler runs Python code, it can handle quantitative analysis, filtering, and data cleaning.
1. Counting Common Responses Google Forms lists every text response individually, making it hard to spot patterns.
- Prompt: "In the 'Department' column, count how many responses came from each department and show the top 5."
2. Analyzing Multiple Choice Questions Google Forms shows pie charts, but you can't easily combine or filter them.
- Prompt: "What are the top 3 most selected features in the 'Which features do you use?' question?"
3. Finding Response Patterns Google Forms doesn't show when most people responded.
- Prompt: "Show me how many responses were submitted each day. Were there any spikes?"
4. Filtering by Response Value Drill down into specific segments of your respondents.
- Prompt: "Show me all responses where satisfaction is 5. How many are there and what department are they from?"
5. Cross-Tabulation (Correlations) Find relationships between different questions.
- Prompt: "Compare the 'Department' column with the 'Satisfaction Score' column. Which department has the lowest average score?"
6. Cleaning Data If your survey allowed multiple submissions, your data might be skewed.
- Prompt: "Check for duplicate email addresses in the 'Email' column. If duplicates exist, analyze the most recent submission only and ignore the older ones."
Troubleshooting
- My column names are long questions: Kepler can handle full questions as headers (e.g., "On a scale of 1-10, how likely are you to...?"). However, you can refer to them by keywords in your prompt (e.g., "Analyze the 'Likely to recommend' column").
- Can I analyze multiple forms together? Yes! Import response sheets from multiple forms as separate data sources, then ask Kepler to compare or combine them.